Du fragst Dich, warum die Unternehmen aus dem Bereich der sauberen Energien (Clean Energy) in Deinem Portfolio aktuell nicht so gut abschneiden? Lies weiter, um zu verstehen, wie sich Inflation, Zinsen und andere Faktoren auf die Aktienkurse auswirken können – und was das für Dich bedeutet.
Was sind die neuesten Entwicklungen bei der Inflation und den Zinssätzen?
Die Inflation ist die Rate, mit der die Preise für Waren und Dienstleistungen im Laufe der Zeit steigen. Sie wird als prozentuale Veränderung des Preises eines Warenkorbs von Waren und Dienstleistungen gemessen. Stell dir vor, Du hast im Jahr 2022 EUR 100 für Lebensmittel ausgegeben. Aufgrund verschiedener Faktoren ist der Gesamtpreis gestiegen und für den gleichen Warenkorb musst Du jetzt EUR 120 bezahlen. Die Inflationsrate in diesem Beispiel beträgt 20 % pro Jahr.
Es gibt viele Gründe für Preiserhöhungen, z. B. höhere Kosten für Rohstoffe oder Löhne. Eine gewisse Inflation auf niedrigem Niveau ist jedoch normal und sogar gesund für eine Volkswirtschaft. Denn sie ermutigt die Menschen, ihr Geld lieber jetzt als später auszugeben, was das Wirtschaftswachstum ankurbeln kann. Eine hohe Inflation hingegen kann das Wirtschaftswachstum bremsen, da die gestiegenen Kosten Investitionen und Innovationen behindern. Das kann so weit gehen, dass Unternehmen ihren Zahlungsverpflichtungen nicht mehr nachkommen können und Insolvenz anmelden.
Einer der wichtigsten Hebel, mit dem die Zentralbanken die Inflation kontrollieren, sind die Zinssätze. Die Zinssätze spiegeln die Kosten für die Aufnahme von Geld wider. Wenn die Zentralbanken die Zinssätze erhöhen, wird es für Menschen und Unternehmen teurer, sich Geld zu leihen, da die Zinssätze für Kredite steigen. Das kann dazu beitragen, die Wirtschaft zu verlangsamen und die Inflation zu senken. Umgekehrt wird es billiger, sich Geld zu leihen, wenn die Zentralbanken die Zinssätze senken. Das kann dazu beitragen, die Wirtschaft anzukurbeln und die Inflation zu erhöhen. In den letzten Monaten haben die Zentralbanken den Zinsmechanismus ausgiebig genutzt, um die Preisstabilität zu gewährleisten und die Inflation zu steuern.
Inflationsraten USA und Eurozone

USA
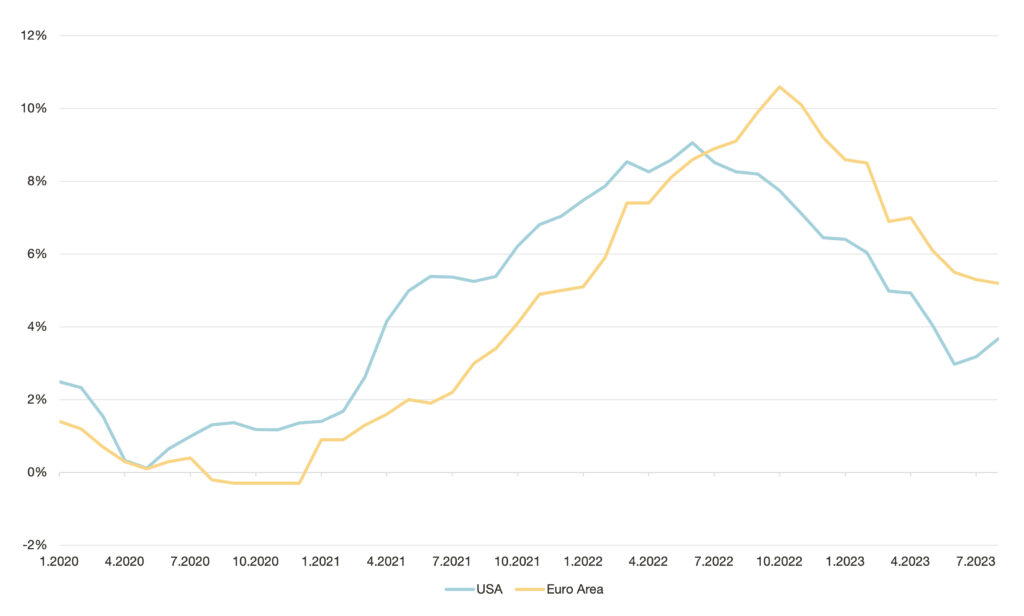
Die US-Inflationsrate lag im August 2023 bei 3,67%, verglichen mit 3,18% im Juli 2023 und 8,26% im letzten Jahr. Im Juni 2023 sank die Inflation zum ersten Mal seit mehr als zwei Jahren unter 4%. Die langfristige Zielinflationsrate der US-Notenbank liegt bei 2%.
Die US-Notenbank (Fed) hat die Zinssätze erhöht, um die Inflation zu bekämpfen. Der Zinssatz der Fed liegt jetzt bei 5,5%, im Juni 2023 waren es noch 5,25%.
Eurozone
Die Inflation in der Eurozone ging im August 2023 auf 5,2% zurück (5,3% im Juli). Obwohl die Inflationsrate seit November 2022 kontinuierlich gesunken ist, liegt sie immer noch deutlich über der von der EZB angestrebten Inflationsrate von 2%.
Um die hohen Inflationsraten zu bekämpfen, hat auch die Europäische Zentralbank (EZB) die Zinssätze erhöht. Der Hauptrefinanzierungssatz der EZB liegt jetzt bei 4,5%, im Juli 2023 waren es noch 4,25%.
Trotz der aktuellen Marktsituation gibt es einige Unternehmen, die eine besonders positive Entwicklung an der Börse aufweisen. Einen ausführlichen Artikel über diese positiven Ausreißer findest Du hier. Es gibt aber auch viele Unternehmen, die unter der Inflation und den Zinsentwicklungen leiden. Unternehmen, die stark von hoher Inflation und hohen Zinsen betroffen sind, sind typischerweise solche, die hohe Produktionskosten, hohe Investitionsausgaben und/oder eine geringe Liquidität haben. Neben anderen Branchen ist auch der Clean Energy-Sektor stark von diesen Entwicklungen betroffen.
Warum Clean Energy-Unternehmen in Schwierigkeiten stecken?
Clean Energy-Unternehmen sind Unternehmen, die Produkte und Dienstleistungen für saubere Energie entwickeln, produzieren oder verkaufen. Clean Energy ist Energie, die aus erneuerbaren Quellen wie Sonne, Wind, Wasser, Erdwärme und Biomasse gewonnen wird. Es handelt sich auch um Energie, die aus Quellen gewonnen wird, die keine oder nur geringe Treibhausgasemissionen verursachen.
Unternehmen für saubere Energie spielen eine wichtige Rolle beim weltweiten Übergang zu einer sauberen und grünere Energiewirtschaft. Durch die Entwicklung und den Einsatz sauberer Energietechnologien tragen diese Unternehmen dazu bei, die Treibhausgasemissionen zu reduzieren und den Klimawandel zu bekämpfen. Darüber hinaus schaffen sie auch Arbeitsplätze und fördern das Wirtschaftswachstum.
Was sind die aktuellen Herausforderungen für saubere Energieunternehmen?
Der Sektor der Clean Energies hat im derzeitigen Umfeld hoher Inflation und hoher Zinssätze aus mehreren Gründen zu kämpfen.
1. Hohe Inputkosten
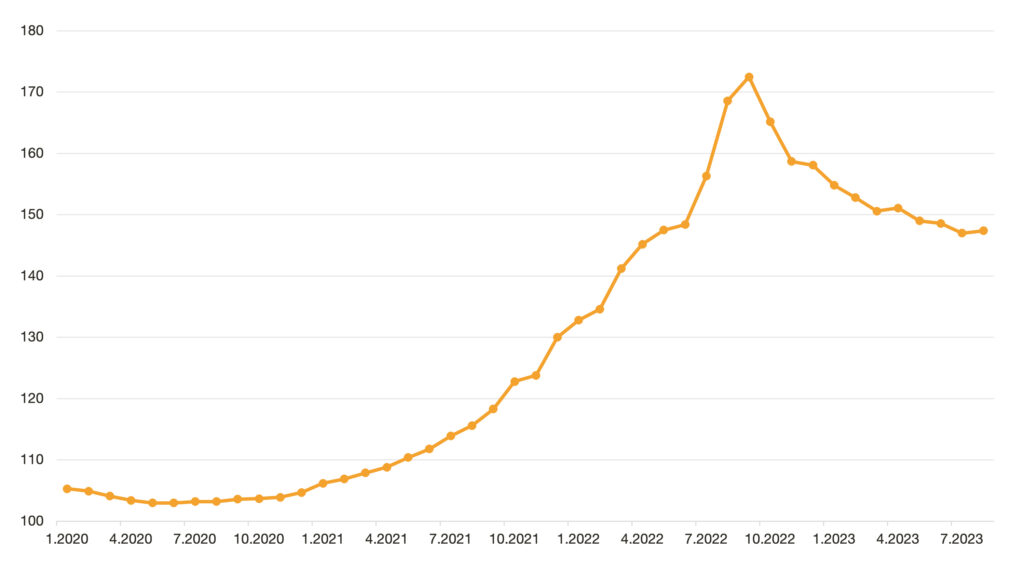
Unternehmen im Bereich der Clean Energy sind in hohem Masse von Rohstoffen oder anderen Inputs abhängig, die während der Inflation teurer werden. Projekte im Bereich der sauberen Energien erfordern oft große Vorabinvestitionen in Anlagen und Materialien, wie z. B. Solarzellen, Windturbinen und Batterien. Die Kosten für diese Betriebsmittel sind in den letzten Monaten aufgrund der Inflation erheblich gestiegen. Nachdem sie Ende 2022 ein Rekordhoch erreicht hatte, sind die Industriepreise im Euroraum weiter gesunken, befinden sich aber immer noch auf einem relativ hohen Niveau.
Erzeugerpreisindex – Industrieerzeugnisse (gesamt)

Quelle: Statistisches Bundesamt (Destatis), 2023
2. Geringe Liquidität und höhere Finanzierungskosten
Die Inflation kann die Kosten eines Unternehmens in die Höhe treiben, während hohe Zinssätze es für das Unternehmen teurer machen können, sich Geld zu leihen. Dies kann dazu führen, dass das Unternehmen weniger Bargeld zur Verfügung hat. Das hat zur Folge, dass es schwieriger wird, seinen finanziellen Verpflichtungen nachzukommen oder – auf der anderen Seite – in Innovationen und Projekte zu investieren. Clean Energy-Unternehmen befinden sich in der Regel in einer früheren Phase ihres Geschäftszyklus. Daher fehlen ihnen derzeit möglicherweise die finanziellen Mittel, um große Projekte zu realisieren. Gleichzeitig ist es für sie aufgrund der hohen Zinssätze teurer, Kredite für diese Projekte aufzunehmen. Dies verringert die Investitions- und Innovationskraft dieser Clean Tech-Unternehmen.
3. Geringere Nachfrage
Eine hohe Inflation und hohe Zinssätze können zu einer Verlangsamung des Wirtschaftswachstums führen. Dies kann die Nachfrage nach sauberer Energie verringern, da Unternehmen und Verbraucher*innen möglicherweise weniger in neue Projekte investieren oder kostenbewusster sind.
Welchen Einfluss hat der globale Wettbewerb auf den Clean Energy–Sektor ?
Betrachtet man den globalen Markt für saubere Energie, so ist der Einfluss der chinesischen Konkurrenz auf die europäischen und nordamerikanischen Hersteller enorm. In den letzten Jahren hat sich China zu einem wichtigen Akteur auf dem Markt für erneuerbare Energien entwickelt. In der Solarbranche ist China bereits führend und vergrößerte bereits seinen Marktanteil bei Windturbinen und Batterien für Elektrofahrzeuge. Das setzt die europäischen Hersteller unter Druck. (S&P Global, 2022; Mobility Foresight, 2021)
Chinesische Hersteller haben einen Wettbewerbsvorteil gegenüber ihren europäischen Konkurrenten, weil sie finanziell solide sind, eine effiziente Lieferkette haben und nicht auf internationale Expansion angewiesen sind. Während die europäischen Hersteller mit Unterbrechungen der Lieferkette, der russischen Invasion in die Ukraine und steigenden Rohstoffkosten zu kämpfen haben, profitieren die chinesischen Produzenten weiterhin von sinkenden Turbinenpreisen und einem starken Binnenmarkt. Darüber hinaus haben chinesische Unternehmen die effizienteste und kostengünstigste Lieferkette der Branche aufgebaut, was ihnen einen erheblichen Vorteil gegenüber ihren europäischen und nordamerikanischen Konkurrenten verschafft (S&P Global, 2022).
Aber das ist nicht die ganze Geschichte. Viele ausländische Solarunternehmen verkaufen ihre Produkte zu Preisen, die unter den Herstellungskosten liegen. Das nennt man “Preisdumping”. Fünf Solarunternehmen, darunter zwei aus China, wurden kürzlich wegen Preisdumpings verurteilt, weil sie gegen Handelsgesetze verstoßen haben. Sie taten dies, indem sie ihre Produkte über andere Länder verschifften, in denen die Arbeits- und Materialkosten niedriger sind (Reuters, 2023). Das macht es für nordamerikanische und europäische Solarunternehmen sehr schwierig, im Geschäft zu bleiben, und solange die Regulierungsbehörden das Preisdumping nicht stoppen, wird es für sie schwer sein, im Wettbewerb zu bestehen.
Wie wirken sich diese Herausforderungen auf die Entwicklung von Clean Energy-Unternehmen aus?
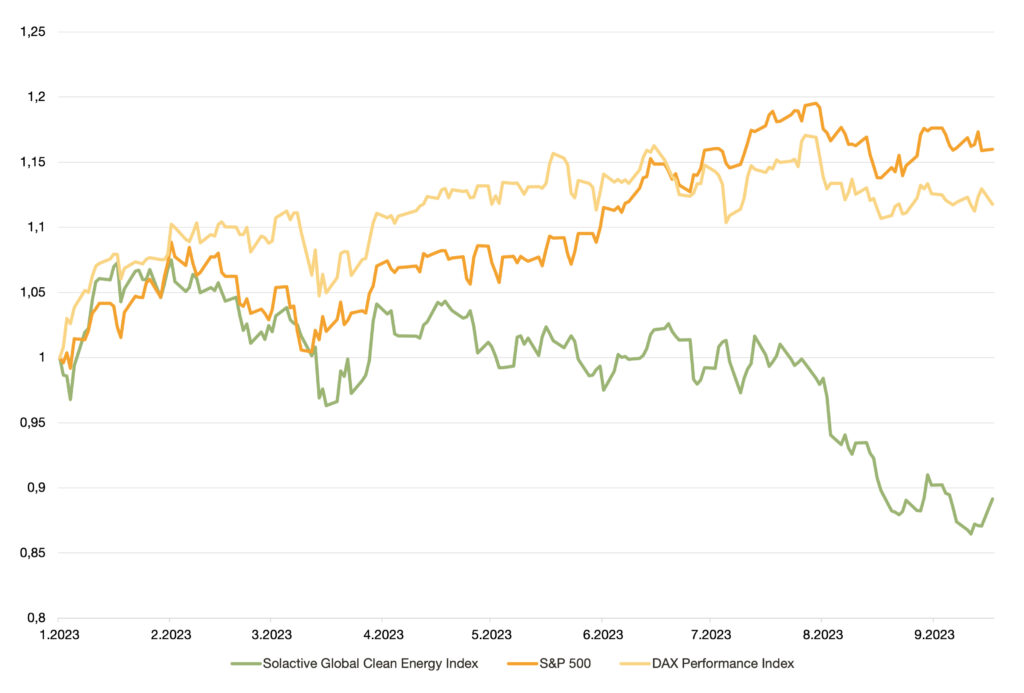
Um die Auswirkungen der oben genannten Entwicklungen auf die Leistung von Unternehmen im Clean Energy-Bereichzu beurteilen, ist es hilfreich, den Solactive Global Clean Energy Index zu betrachten. Aufgrund von Zusammenstellung und Fokus bietet sich der Index als Repräsentant für den Clean Energy Sektor als Gesamtes an. Der Solactive Global Clean Energy Index ist ein Börsenindex, der die Wertentwicklung von Unternehmen abbildet, die in der sauberen Energiebranche tätig sind. Dazu gehören Unternehmen, die erneuerbare Energien wie Solar- und Windenergie erzeugen, sowie Unternehmen, die saubere Energietechnologien wie Elektrofahrzeuge und Batteriespeichersysteme entwickeln und herstellen. Der Index ist nach der Marktkapitalisierung gewichtet, d. h. die größten Unternehmen im Index haben den größten Einfluss auf die Wertentwicklung des Index. Der Index ist global ausgerichtet und umfasst 38 Unternehmen hauptsächlich aus Europa, Nordamerika und Japan. Derzeit sind keine chinesischen Unternehmen im Index vertreten. Daher kann der Index nicht von den Entwicklungen der chinesischen Unternehmen profitieren. Der Solactive Global Clean Energy Index ist eine beliebte Benchmark für Investor*innen, die in den Clean Energy-Sektor investieren wollen. Hier sind einige der Unternehmen, die im Solactive Global Clean Energy Index enthalten sind: EDP RENOVAVEIS SA, FIRST SOLAR INC, ORSTED A/S, TESLA INC, und viele andere.
Bis Februar 2023 haben sich S&P 500, DAX 40 und der Solactive Global Clean Energy Index sehr ähnlich entwickelt. Seit Februar weichen die Entwicklungen jedoch voneinander ab. Während die Kurven des S&P 500 und des DAX 40 seither nach oben tendieren, verzeichnet der Solactive Global Clean Energy Index einen rückläufigen Trend. Dies unterstreicht, dass die hohe Inflation, die gestiegenen Zinsen und der Druck durch die Konkurrenz aus Übersee einen erheblichen und nachhaltigen Einfluss auf den Erfolg von Unternehmen der Clean Energy haben.

Was bedeutet das für Dein Portfolio?
Mehr als 90 % der Inyova Impact-Investor*innen haben in der ersten Hälfte des Jahres 2023 das Handabdruck-Thema erneuerbare Energien in ihre Investitionsstrategie aufgenommen. Europäische und nordamerikanische Hersteller sauberer Energien sind für die Zukunft gut aufgestellt, trotz des derzeitigen Drucks durch Inflation, Zinssätze und ausländische Wettbewerber. Die europäischen Unternehmen der Clean Energy stehen an der Spitze der Innovation und entwickeln und nutzen neue Technologien, um der Welt den Übergang zu einer sauberen Energiezukunft zu erleichtern. Im Jahr 2022 zogen europäische Unternehmen für saubere Energien EUR 11 Mrd. an Investitionskapital an. (Cleantech for Europe, 2023) Diese Investitionen werden dazu beitragen, die Entwicklung und Kommerzialisierung neuer Technologien wie Offshore-Windkraft, Photovoltaik und Batteriespeicher zu beschleunigen. Europäische Clean Energy-Unternehmen sind auch führend bei der Entwicklung neuer Geschäftsmodelle, wie Energy-as-a-Service und Energy Communities. Diese Modelle tragen dazu bei, saubere Energie erschwinglicher und für alle zugänglich zu machen (World Economic Forum, 2023).
Außerdem wächst das Bewusstsein für die Notwendigkeit grüner Energie bei Menschen und Regierungen. In den letzten Jahren haben die Ausgaben für grüne Energien weltweit stark zugenommen, und für 2023 werden Investitionen in saubere Energien in Höhe von USD 1.740 Mrd. prognostiziert. Die Ausgaben für fossile Energieträger werden im gleichen Zeitraum voraussichtlich bei USD 1.050 Mrd. liegen. Die Ausgaben für erneuerbare Energien steigen seit 2019 deutlich stärker, als fossile Energieausgaben (IEA, 2023).
Auch wenn Aktien aus dem Clean Energy-Sektor derzeit ein wenig auf Talfahrt sind, gibt es wissenschaftliche Belege dafür, dass sich nachhaltige Investitionen im Allgemeinen eher auszahlen und langfristig besser abschneiden als konventionelle Investitionen (NYU Stern, 2021). Der Grund dafür ist, dass letztere eher “gestrandete Vermögenswerte” (oder “Stranded Assets”) enthalten, die derzeit die Aktienkurse in die Höhe treiben können, obwohl die Aussicht besteht, dass diese Vermögenswerte in Zukunft wertlos werden könnten. Ein gutes Beispiel für einen “gestrandeten Vermögenswert” bei einem Unternehmen, das fossile Brennstoffe fördert, sind nachgewiesene, aber nicht erschlossene Öl- und Gasreserven. Wenn sich die Welt von fossilen Brennstoffen wegbewegt, wird die Nachfrage nach Öl und Gas sinken. Das bedeutet, dass einige Öl- und Gasreserven nie erschlossen werden und die Unternehmen, die sie besitzen, Milliarden von Dollar an potenziellen Gewinnen verlieren. Nachhaltige Unternehmen hingegen sind weniger von Stranded Assets bedroht, weil sie in die saubere Zukunft investieren. Die Welt befindet sich im Übergang zu einer sauberen Energiewirtschaft, und nachhaltige Unternehmen stehen bei diesem Übergang an vorderster Front. Sie entwickeln und setzen neue Technologien ein, die uns helfen, unsere Abhängigkeit von fossilen Brennstoffen zu verringern und die Klimakrise zu bewältigen.
Neben dem langfristig positiven Ausblick ist Dein Inyova-Portfolio mit Aktien und Anleihen aus zahlreichen Sektoren, Regionen, Währungen und Ländern gut diversifiziert. Es umfasst große, mittlere und kleinere Unternehmen aus verschiedenen Branchen. Trotzdem überprüfen wir Dein Portfolio ständig und sorgen dafür, dass es gut diversifiziert ist. Zweitens prüfen wir auch ständig, ob wir neue Unternehmen in innovativen Bereichen hinzufügen wollen. Wenn wir interessante Unternehmen finden, die auch unsere strengen Leistungs- und Nachhaltigkeitskriterien erfüllen, nehmen wir sie in das Inyova-Universum auf. Deine Investition bei Inyova ist ein langfristiger Ansatz, der sich auf die Erwirtschaftung langfristiger Gewinne konzentriert.
Werbemitteilung: Bei den hier dargestellten Informationen und Wertungen handelt es sich um eine Werbemitteilung, die nicht im Einklang mit Rechtsvorschriften zur Förderung der Unabhängigkeit von Finanzanalysen erstellt wurde und auch keinem Verbot des Handels im Anschluss an die Verbreitung von Finanzanalysen unterliegt. Der Erwerb dieser Vermögensanlage ist mit erheblichen Risiken verbunden und kann zum vollständigen Verlust des eingesetzten Vermögens führen. Die Inyova erhält für ihre Dienstleistungen eine All-inclusive-Gebühr von 0,9 – 1,2 % p.a. je nach Höhe des verwalteten Vermögens. Die genaue Berechnung kann unter www.inyova.de/gebuehr abgerufen werden.
Risikohinweis: Alle Angaben dienen nur der Unterstützung Deiner selbstständigen Anlageentscheidung und stellen keine Empfehlung der Inyova dar. Die dargestellten Produktinformationen bzw. Rechenbeispiele erheben keinen Anspruch auf Vollständigkeit oder Richtigkeit. Maßgeblich sind allein die Vorgaben im Vermögensverwaltungsvertrag inkl. der weiteren gesetzlichen Unterlagen, die Kunden der Inyova über die vollständige Kundendokumentation zur Verfügung gestellt werden. Bitte lies den Vermögensverwaltungsvertrag und die weitern Kundendokumente sorgfältig, bevor Du eine Anlageentscheidung triffst. Für alle Aktien und ETFs gilt: Wertentwicklungen in der Vergangenheit sind keine Garantie für eine entsprechende Wertentwicklung in der Zukunft. Angaben zur bisherigen Wertentwicklung erlauben keine Prognosen für die Zukunft. Investitionen in Wertpapiere schließen das Risiko eines Wertverlustes mit ein. Andere Wertpapierdienstleistungen können andere Ergebnisse erzielen. Die Ergebnisse für individuell verwaltete Depots sowie die verschiedenen Zeitabschnitte können aufgrund der Marktlage, unterschiedlicher Einstiegszeitpunkte, unterschiedlicher Depotgrößen, individueller Restriktionen und der jeweiligen Zusammensetzung des Portfolios abweichen.
Haftungsausschluss: Die Wertentwicklung von Finanzmärkten und -instrumenten in der Vergangenheit ist niemals ein Indikator für die Wertentwicklung in der Zukunft. Die Aussagen oder Informationen in diesem Dokument stellen keine Empfehlung, kein Angebot, keine Aufforderung zum Kauf oder Verkauf von Wertpapieren oder Finanzinstrumenten dar. Die Inyova GmbH übernimmt keinerlei Gewähr hinsichtlich der Zuverlässigkeit und Vollständigkeit der Informationen dieses Artikels. Haftungsansprüche gegen die Inyova GmbH wegen Schäden, welche aus der Nutzung der in diesem Dokument veröffentlichten Informationen entstanden sind, werden ausgeschlossen. Darüber hinaus spiegeln die in diesem Dokument enthaltenen Aussagen eine Einschätzung zum Zeitpunkt der Veröffentlichung wider und können sich ändern. Verweise und Links auf Webseiten Dritter liegen außerhalb des Verantwortungsbereichs der Inyova GmbH. Jegliche Verantwortung für solche Webseiten wird abgelehnt.
EU-Nachhaltigkeitsregulierung: Die Begriffe und Kategorien aus diesem Beitrag entsprechen nicht den Begriffen und Kategorien aus der EU-Nachhaltigkeitsregulierung. Die im Rahmen der EU-Nachhaltigkeitsregulierung vorgeschriebenen Offenlegungen und Erläuterungen findet ihr unter https://inyovagmbhpro.wpenginepowered.com/beruecksichtigung-von-nachhaltigkeitsthemen/.
